The right way to make animations with Matlab
This page explains how to make animations with Matlab. The idea is to create a figure, get the associated object and update these objects properties. The page presents a step by step guide. If you are familiar with Matlab, go straight to the example code.
Create a figure
First create a figure, here we will just draw a point at coordinates (10,10) in a new figure. First create a new figure:
figureForce the axis between 0 and 20 on each axis:
axis ([0,20,0,20])Keep the previous content in the figure:
hold onDraw a point and get properties
Draw the point, note that we will get the plot properties in the object h:
h = plot (10,10,'o');Your figure should look something like:

When drawing the point, we get the object properties (h). We can now
access the object properties with the following command:
>> get (h)
    AlignVertexCenters: 'off'
            Annotation: [1×1 matlab.graphics.eventdata.Annotation]
          BeingDeleted: 'off'
            BusyAction: 'queue'
         ButtonDownFcn: ''
              Children: [0×0 GraphicsPlaceholder]
              Clipping: 'on'
                 Color: [0.9290 0.6940 0.1250]
             CreateFcn: ''
             DeleteFcn: ''
           DisplayName: ''
      HandleVisibility: 'on'
               HitTest: 'on'
         Interruptible: 'on'
              LineJoin: 'round'
             LineStyle: 'none'
             LineWidth: 0.5000
                Marker: 'o'
       MarkerEdgeColor: 'auto'
       MarkerFaceColor: 'none'
         MarkerIndices: 1
            MarkerSize: 6
                Parent: [1×1 Axes]
         PickableParts: 'visible'
              Selected: 'off'
    SelectionHighlight: 'on'
                   Tag: ''
                  Type: 'line'
         UIContextMenu: [0×0 GraphicsPlaceholder]
              UserData: []
               Visible: 'on'
                 XData: 10
             XDataMode: 'manual'
           XDataSource: ''
                 YData: 10
           YDataSource: ''
                 ZData: [1×0 double]
           ZDataSource: ''
The previous command display all the properties of the point. Most usefull properties are :
- XData : the X-coordinate of the point
- YData : the Y-coordinate of the point
- Color : the color of the point
- Marker : the style of the marker
- MarkerSize : the size of the marker
Updating properties
To create an animation, we will not redraw the point, we will update its properties
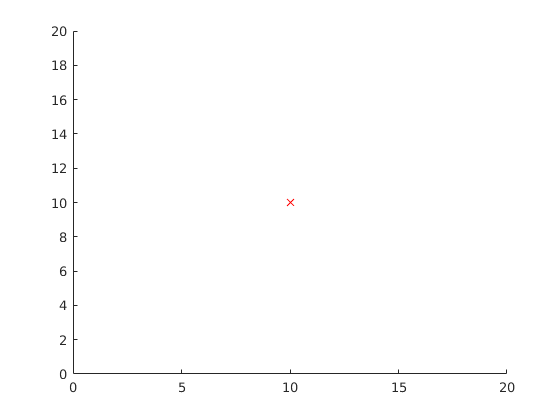
with the command set. First, let's change the point marker:
set (h, 'Marker', 'x')The marker should be changed to a cross:

We can also change the marker color:
set (h, 'Color', 'r')Display should be updated:
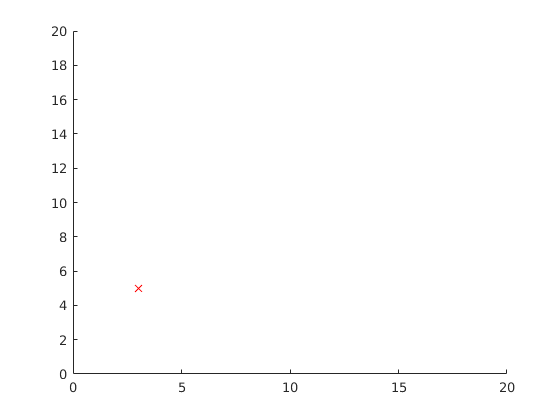
The most important attribute to create animation is to update the points coordinates. We can change several attribute with the same command. The following command update the X and Y coordinates of the point:
set (h, 'XData',3, 'YData', 5)Here, the point has moved to coordinates (3,5):
Animate in a loop
The following code draw a vertical line and animate the line to turn around the point (0,0):
close all;
clear all;

%% Initialization of the figure

% Draw the line and get line properties
l = line ([0,0] , [0,1]);
% Set axis
axis ([-2,2,-2,2]);

%% Main loop

% Loop on the line angle (from 0 radians to 2pi radians
for a=0:0.01:2*pi
    % Update the line coordinates
    set (l, 'XData',[0,sin(a)], 'YData',[0, cos(a)] );

    % Refresh the figure
    drawnow;
end
Here is the result :
See also
- How to calculate intersection points between two circles in Matlab?
- Load MNIST database in Matlab
- Load MNIST database in Matlab
- Matlab optimization, example of function optimization