Matplotlib and Visual Studio Code
The commands on the following page has been performed and tested with the following versions:
- Ubuntu 18.04 LTS 64bits
- Linux 4.15.0-76-generic
- Python 3.6.9
- Visual Studio Code 1.42.1
Installation and configuration of Python and Visual Studio Code has been perfomed by following this step by step guide.
Update your system
Start by updating your system:
sudo apt update
sudo apt upgrade
Install matplotlib
If you work with virtual environments, do not forget to activate your environment before installing matplotlib, otherwise it will be installed system wide. The following command installs matplotlib:
sudo apt install python3-matplotlibor:
python -m pip install -U matplotlibCreate and run the following Python script:
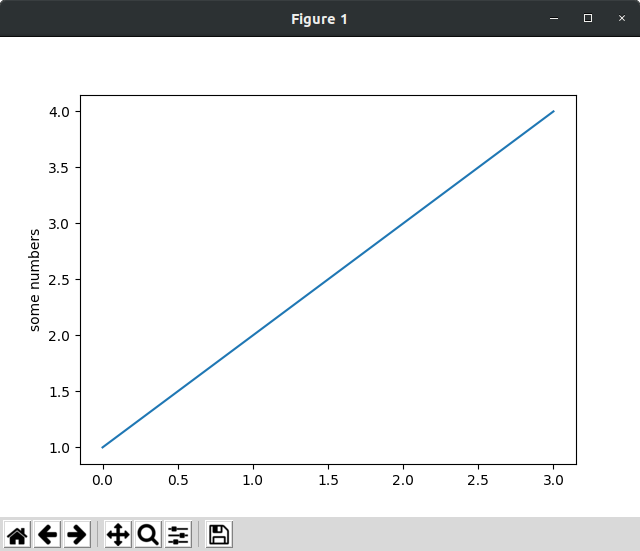
import matplotlib.pyplot as plt
plt.plot([1, 2, 3, 4])
plt.ylabel('some numbers')
plt.show()
If the chart is not displayed or if you get the following error UserWarning: Matplotlib is currently using agg, which is a non-GUI backend, so cannot show the figure.
install tkinter:
sudo apt-get install python3-tkThe script should now display the following figure:
See also
- How to compute all the factors of a given number in Python
- Copy lists in Python
- Count list elements in Python
- Create lists in Python
- DataFrames in Pandas/Python
- Delete lists in Python
- Get list elements in Python
- How to get and parse HTML pages in Python?
- Insert, append, extend and concatanate lists in Python
- Install Visual Studio Code on Ubuntu for Python
- Iterate over lists in Python
- Remove an element from a list in Python
- Reverse lists in Python
- Find elements in lists in Python
- Slice lists in Python
Last update : 02/21/2020