Hall effect sensor Allegro A31301
Introduction
This page presents a small demonstrator of the Allegro hall-effect sensor A31301. This demo is based on an ESP32 connected to the sensor. Raw data are read from the sensor and sent on the UART. On the other side of the UART a Python script gets data and display data on the screen. One of the great advantages of the A31301 sensor is that its I²C address is configurable (16 with external resistors and 127 with programming).
Wiring
The demonstration has been made on a breadboard with an ESP32 Firebettle 2 and a small home made breakout board for the A31301.
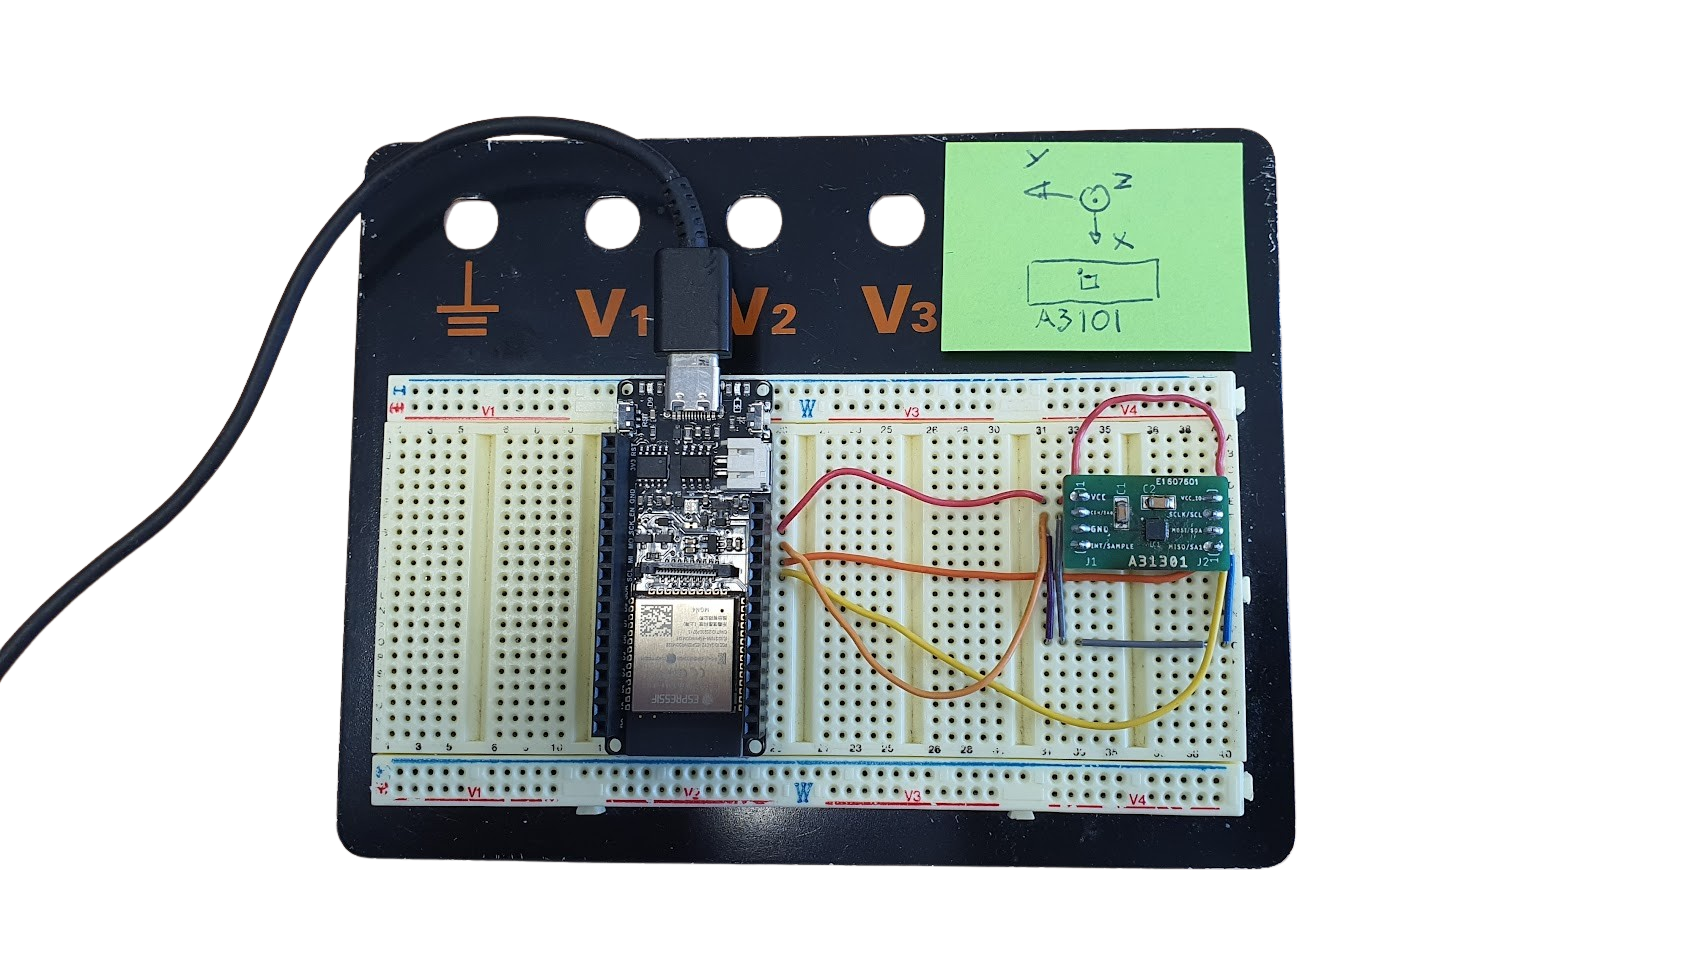
Here is how the A31301 has been wired on the ESP32:
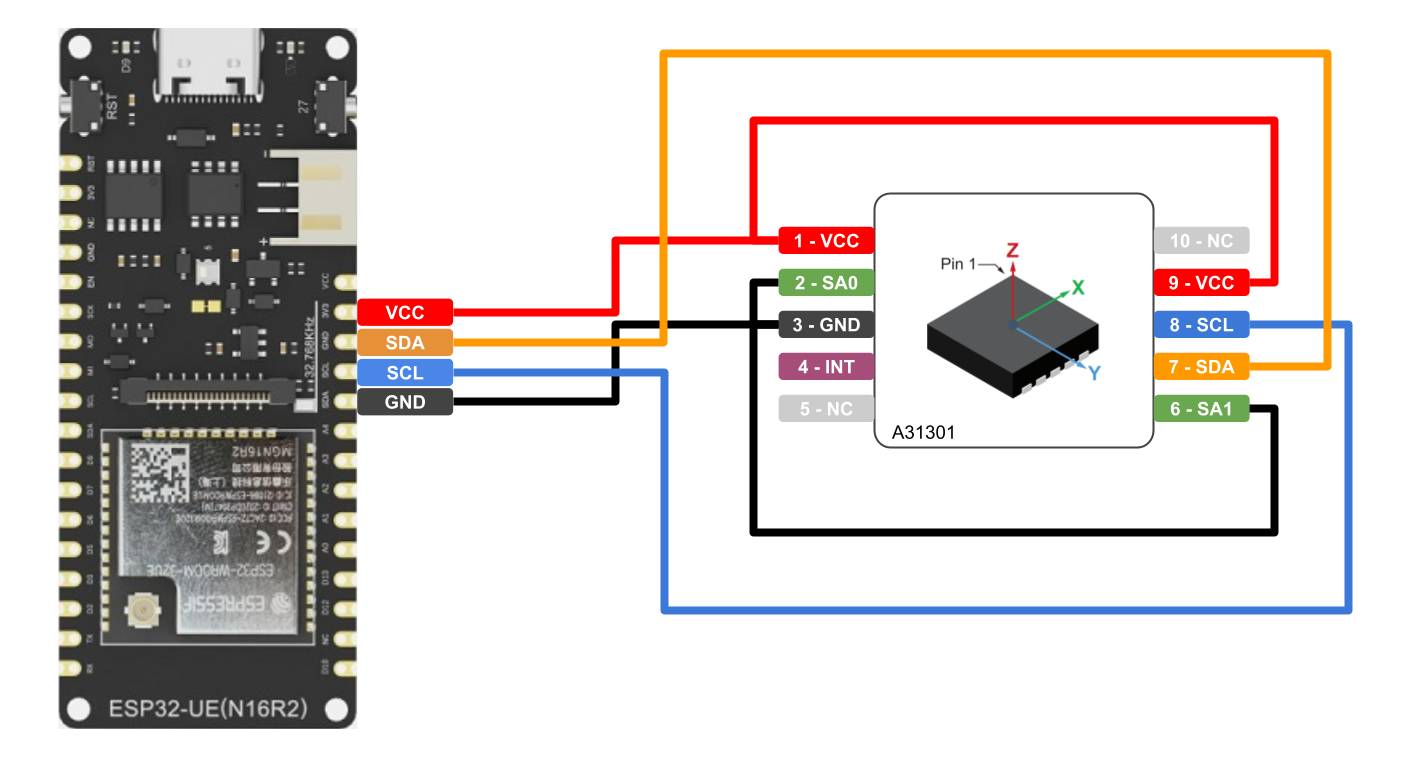
First, the A31301 must be powered. Since the sensor is a low power device powered in 3.3V, it can be connected to the ESP32 regulator without any problem. The A31301 has SPI and I²C interfaces. Since I would like to use many sensors, I²C is the best suited protocol. For this demo, I connected the pin SA0 and SA1 to the ground to set the 96 (0x60) I²C address.
ESP32 source code
The source code of the ESP32 can be downloaded at the bottom of this page. note that it should also work for many other Arduino compatible board.
We'll focus here on the main functions. First the setup() function initialise the serial communication and the I²C interface:
void setup() {
  // Initialize serial communication
  Serial.begin(115200);
  while (!Serial);

  // I²C initialization
  Wire.begin();
}
In the loop() function, we constantly read the 3 axes magnitude and send it on the serial.
void loop() {
  // Send data on serial
  Serial.print(getX(I2C_A31301_ADDRESS));
  Serial.print(",");
  Serial.print(getY(I2C_A31301_ADDRESS));
  Serial.print(",");
  Serial.println(getZ(I2C_A31301_ADDRESS));

  // 10ms => 100Hz frame rate
  delay(10);
}
The main loop calls the functin getX(), getY() and getZ(). This function read the data from the internal registers of the sensor.
Note this is a 15 bits register so the bit 15 that represent the sign must be copied in the MSB (bit 16).
int16_t getX(byte address) {

  // Read MSB and LSB for X-axis
  uint8_t msb = Request_info(address, REGISTER_MSB_X);
  uint8_t lsb = Request_info(address, REGISTER_LSB_X);

  // Merge MSB and LSB on 15 bits
  int16_t combined = ((msb & 0x7F) << 8) | lsb;

  // Check the 15th bit to duplicate the sign on the 16 bit (0=positive / 1=negative)
  if (combined & 0x4000) combined |= 0x8000;

  return combined;
}
And finally the Request() function creates the I²C frame sent to the device.
It writes the register address and then read the register value.
uint8_t Request_info(uint8_t address, uint8_t registerAddress) {
  // Configure the I²C write/read
  // 1. Write the register address
  // 2. Read the register content
  Wire.beginTransmission(address);
  // Set register address
  Wire.write(registerAddress);
  Wire.endTransmission(false);
  // Read register content
  Wire.requestFrom(address, 1);

  // Return the byte read at the register address
  return Wire.read();
}
Python
As for the Arduino code the Python code that displays the vector can be downloaded at the bottom of this page. The python code create and initialize a MatplotLib figure. It listen to the serial device to get the data send by the ESP32 :
# Read a line from the serial device
line = ser.readline().decode('ascii').strip()
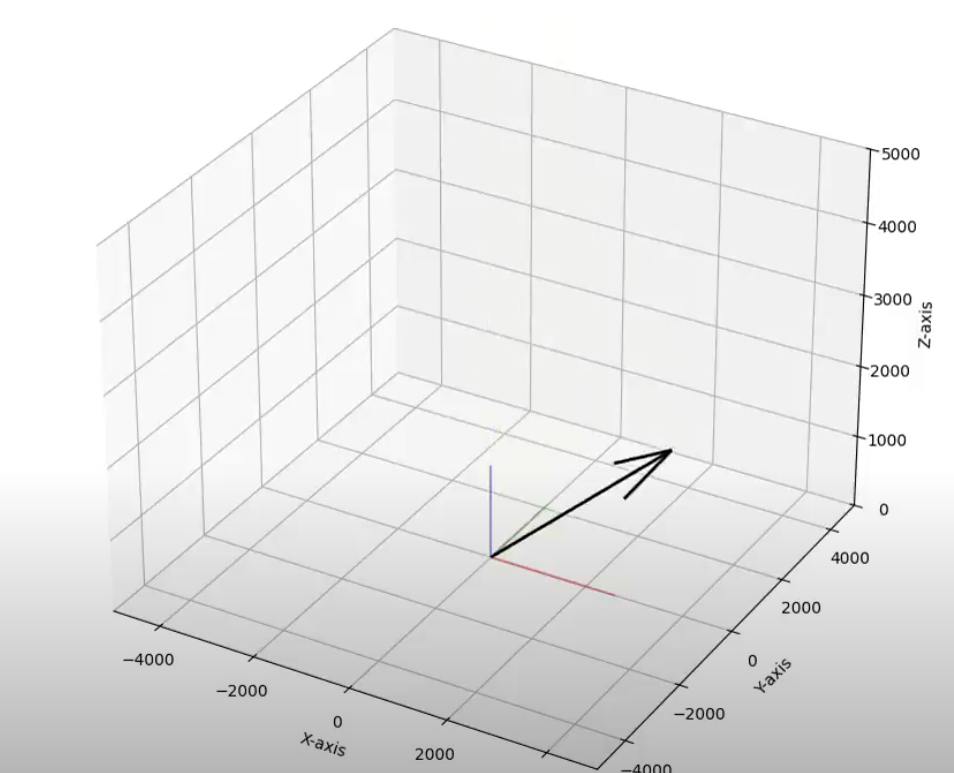
parts = line.split() if ' ' in line else line.split(',')It creates a magnitude vector with the 3 axis. Note that the frame on the first page of the datasheet is not in accordance with the value read from the device. The sign of the Z-axis is not in accordance with the signs of the X and Y-axis. This is why these axis are inverted in the code.
Mag = [ -int(parts[1]), -int(parts[0]), int(parts[2])]The vectors displayed on the figure are build from the magnitude vector:
quiver = ax.quiver(*arrow, color='k', linewidths=2)
quiverX = ax.quiver(*[0,0,0,arrow[3],0,0], arrow_length_ratio=0, color='r', alpha=0.4)
quiverY = ax.quiver(*[0,0,0,0,arrow[4],0], arrow_length_ratio=0, color='g', alpha=0.4)
quiverZ = ax.quiver(*[0,0,0,0,0,arrow[5]], arrow_length_ratio=0, color='b', alpha=0.4)
Finally, an animation is launched with a frame rate of 100fps (10ms):
# Run the animation
ani = FuncAnimation(fig, update,  frames=np.linspace(0,2*np.pi,200), interval=0)
plt.show()
Here is the result:
Acknowledgements
This page is based on the work of my students at the Institute of Technology in Angers. Thanks to them for this great work.
Download
All the files are available on Github.
- ESP32 source code
- Python source code
- A31301 Datasheet
- A31301 breakout schematics
- A31301 breakout board PCB
- Eagle schematics of the AC31301 breakout board
- Eagle PCB board of the AC31301 breakout board
- Student project report 2023/2024 (in French)
See also
- Change A31301 I²C address via EEPROM
- Connector MR30
- Datasheet for the AZDelivery Display SSD1306
- Introduction to LoRa32 V2.1_1.6 Point-to-Point Communication
- Farad to watt.hour capacity converter
- Online resistance calculator